AI Data Visualization - Directory w/ AI Reviews
Turning raw data into clear, compelling visuals is faster than ever with AI-assisted charting and dashboard tools. Flourish and Datawrapper make publication-quality charts accessible to journalists and analysts without coding. Infogram handles infographics and reports, while Observable gives data scientists a collaborative notebook environment for building interactive visualizations with code.
 1
4.6
1
4.6
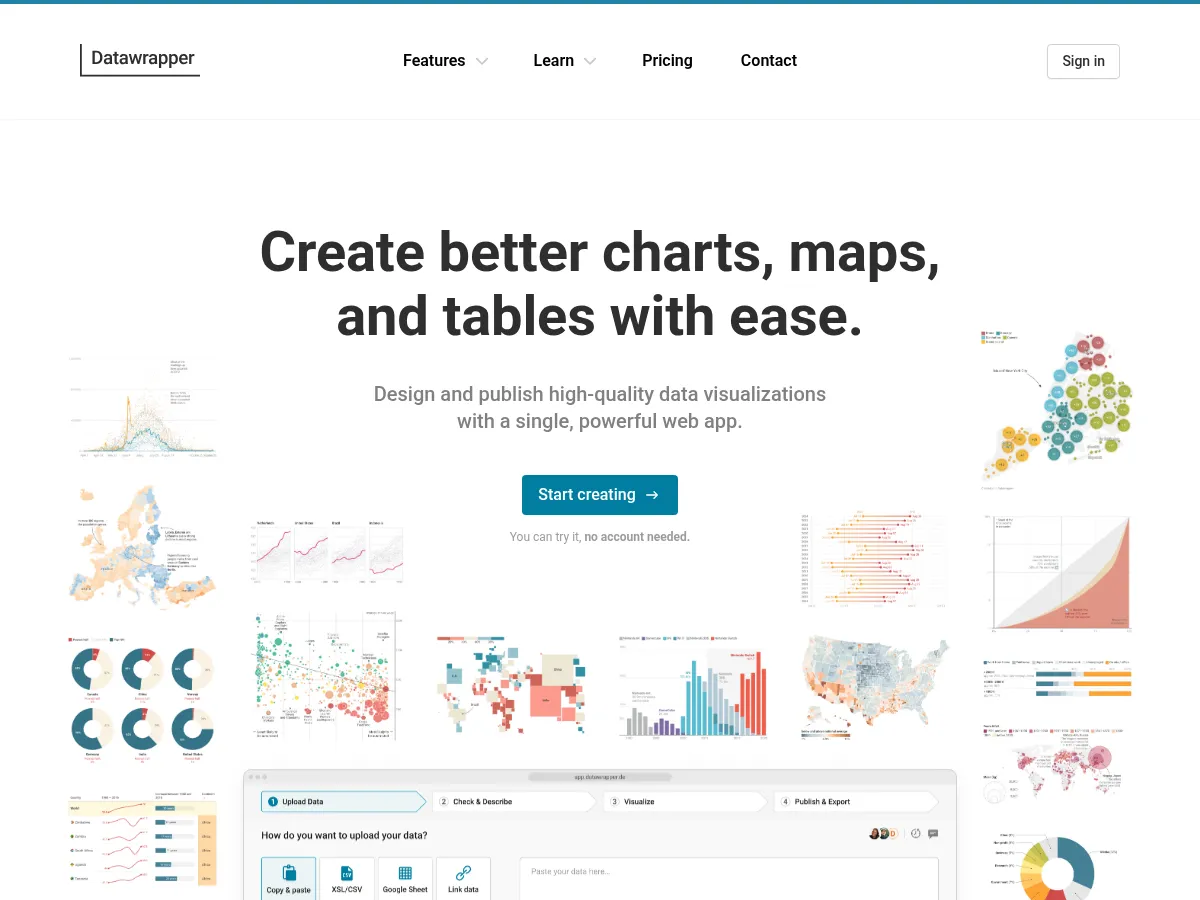
 Datawrapper
Freemium
Free Plan
API
Datawrapper is trusted by newsrooms worldwide for turning raw data into publication-ready charts, maps, and tables.
Datawrapper
Freemium
Free Plan
API
Datawrapper is trusted by newsrooms worldwide for turning raw data into publication-ready charts, maps, and tables.
 2
4.6
2
4.6
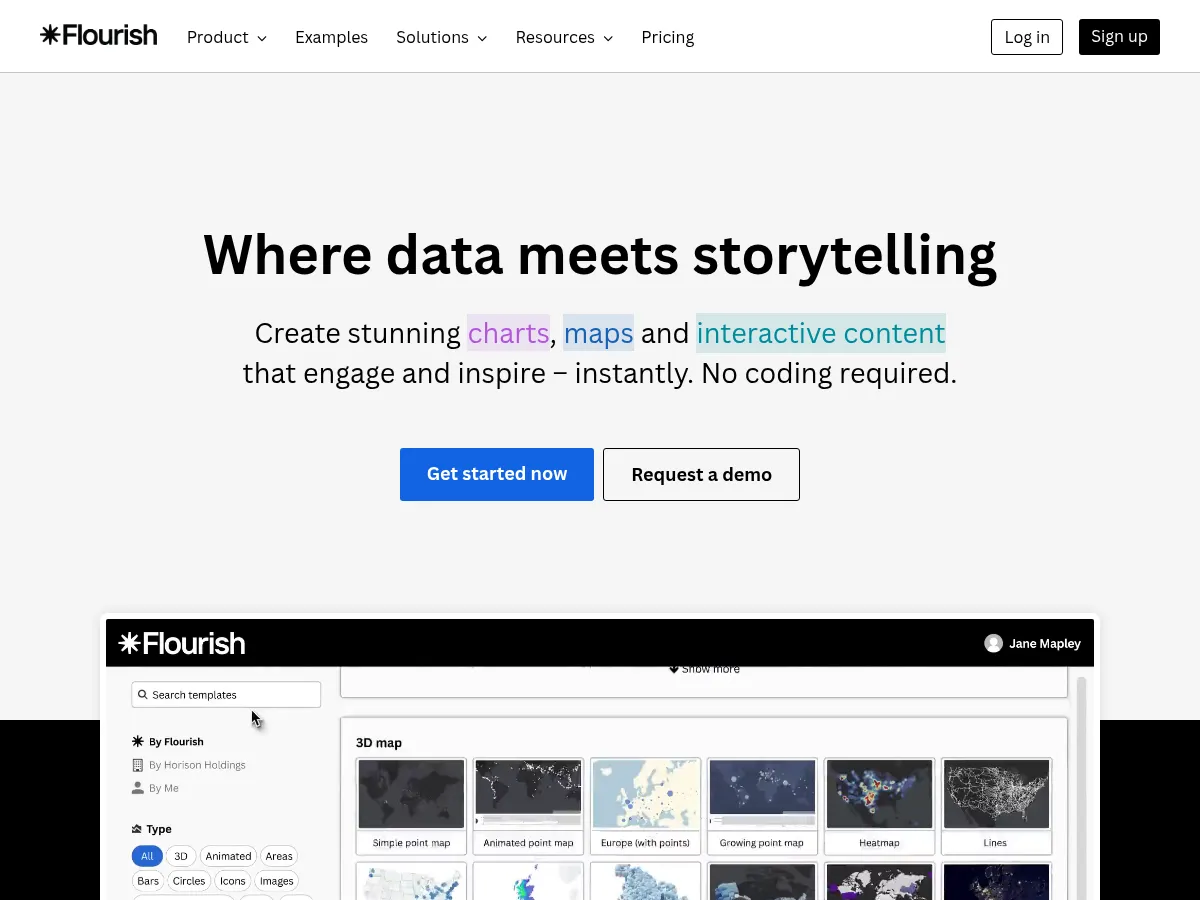
 Flourish
Freemium
Free Plan
API
Flourish creates interactive, animated data visualizations without coding, with templates used by major publishers.
Flourish
Freemium
Free Plan
API
Flourish creates interactive, animated data visualizations without coding, with templates used by major publishers.
 3
4.5
3
4.5
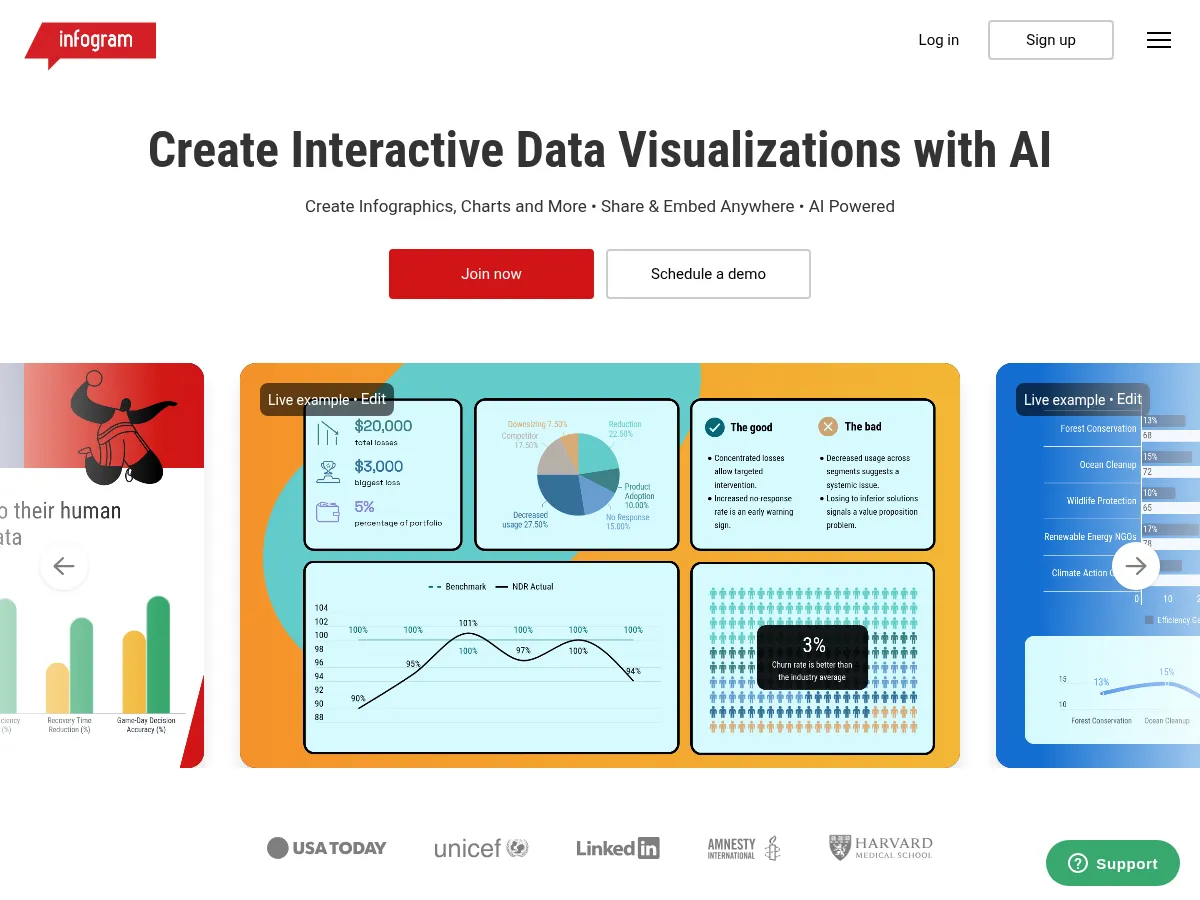
 Infogram
Freemium
Free Plan
API
Infogram is an intuitive data visualization and infographic platform that uses AI to help users create interactive charts, maps, dashboards, and reports. It automatically suggests the best chart types for your data and provides smart formatting to ensure visual clarity. With over 35 chart types, 500
Infogram
Freemium
Free Plan
API
Infogram is an intuitive data visualization and infographic platform that uses AI to help users create interactive charts, maps, dashboards, and reports. It automatically suggests the best chart types for your data and provides smart formatting to ensure visual clarity. With over 35 chart types, 500
 4
4.4
4
4.4
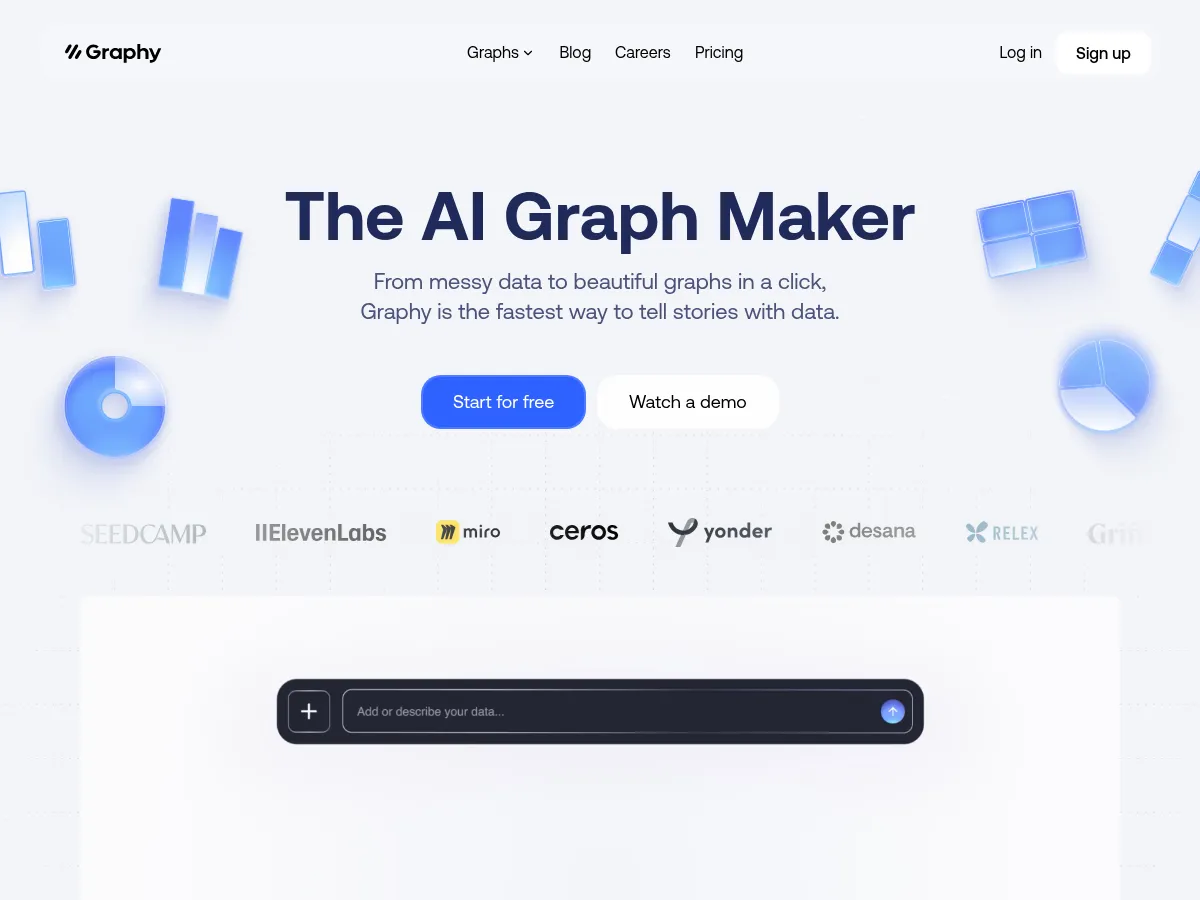
 Graphy
Freemium
Free Plan
Graphy uses AI to create interactive, embeddable charts from spreadsheet data with automatic formatting.
Graphy
Freemium
Free Plan
Graphy uses AI to create interactive, embeddable charts from spreadsheet data with automatic formatting.
 5
4.4
5
4.4
 Observable
Freemium
Free Plan
API
Observable is a collaborative data visualization and analysis platform built around reactive JavaScript notebooks. It enables teams to explore datasets and build interactive visualizations using D3.js, Plot, and other libraries in a live-coding environment. Observable's Framework supports AI-assiste
Observable
Freemium
Free Plan
API
Observable is a collaborative data visualization and analysis platform built around reactive JavaScript notebooks. It enables teams to explore datasets and build interactive visualizations using D3.js, Plot, and other libraries in a live-coding environment. Observable's Framework supports AI-assiste
 6
4.3
6
4.3
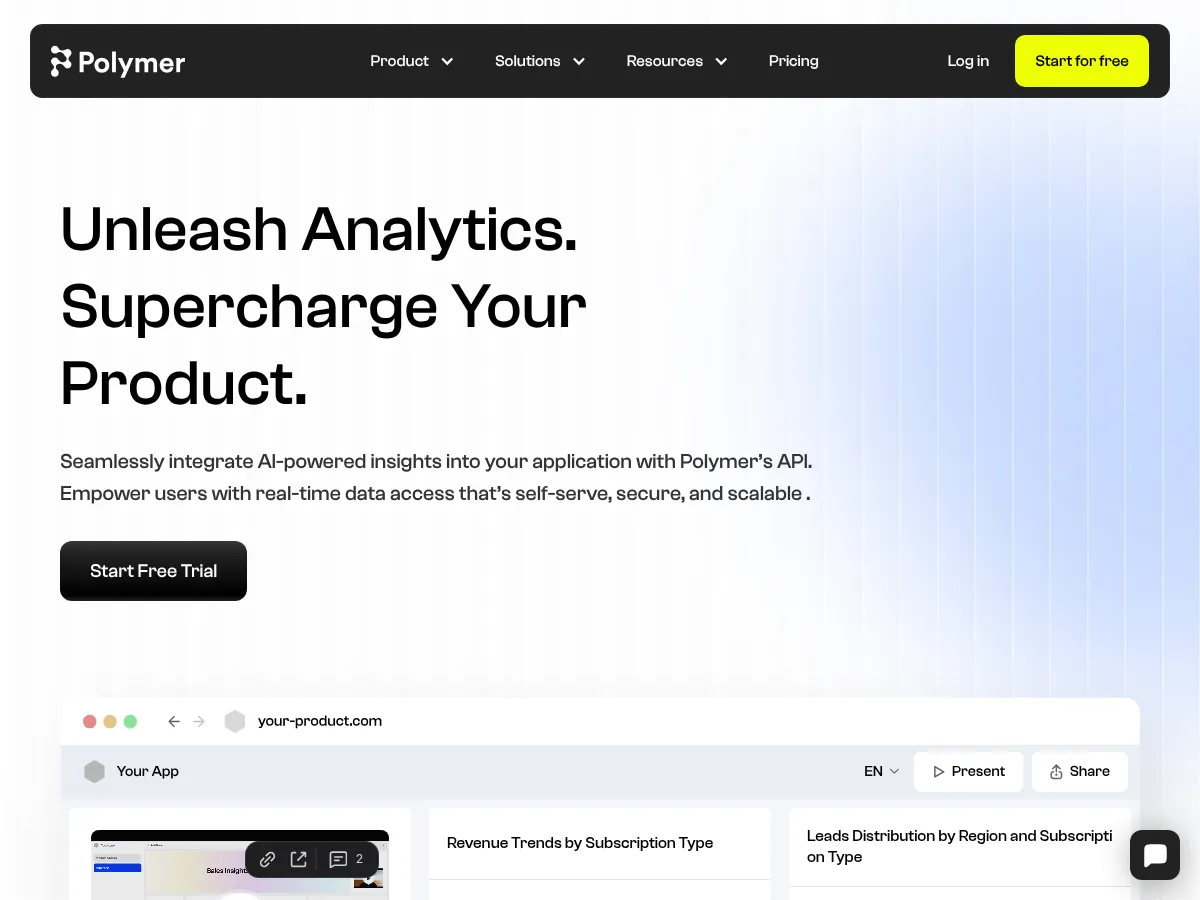
 Polymer Search
Freemium
Free Plan
Polymer Search transforms spreadsheets and datasets into interactive, searchable databases with AI-generated visualizations and dashboards. Users can upload data from Google Sheets, Excel, CSV, or connect to platforms like Shopify and Google Analytics, and the AI engine automatically creates meaning
Polymer Search
Freemium
Free Plan
Polymer Search transforms spreadsheets and datasets into interactive, searchable databases with AI-generated visualizations and dashboards. Users can upload data from Google Sheets, Excel, CSV, or connect to platforms like Shopify and Google Analytics, and the AI engine automatically creates meaning
 7
4.3
7
4.3
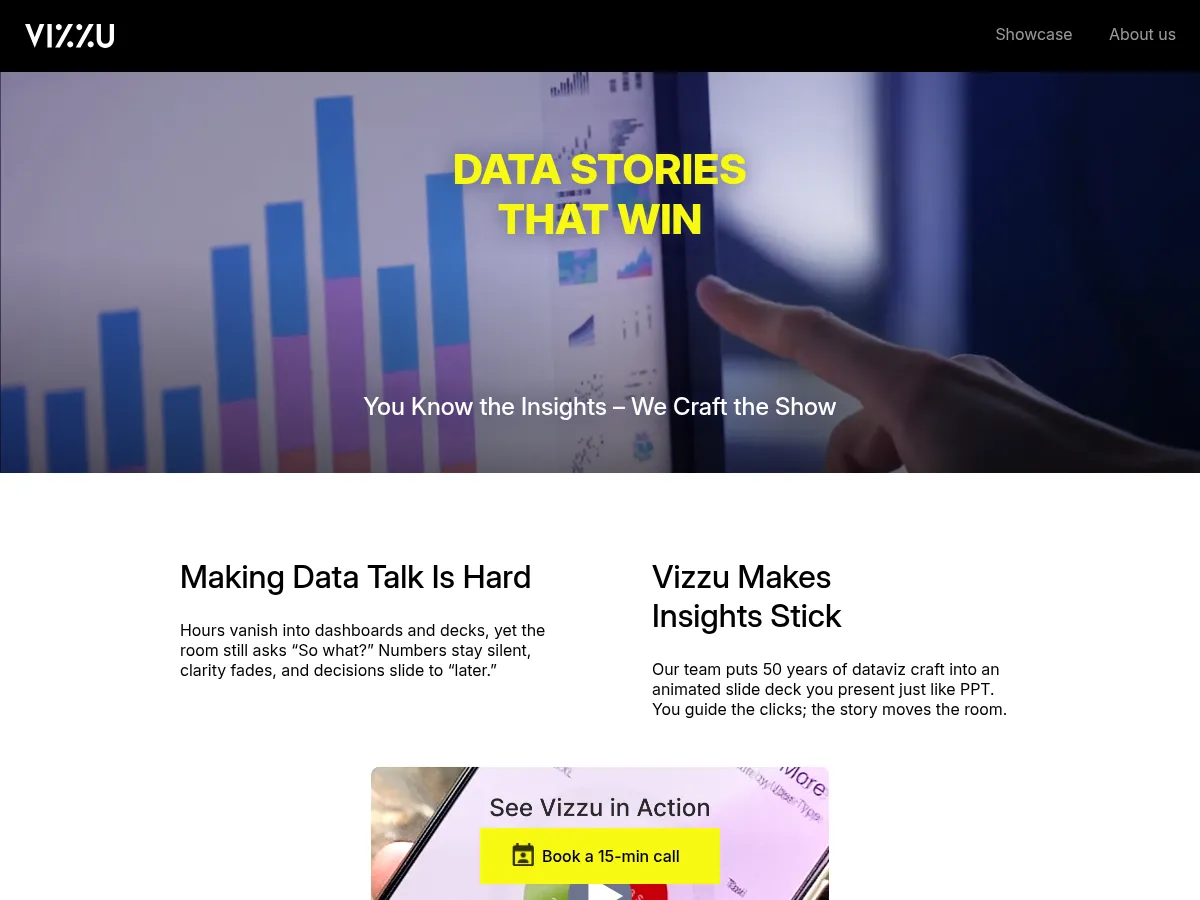
 Vizzu
Free
Free Plan
API
Open Source
Vizzu is an open-source library for animated data visualizations and data stories, using a unique approach where charts morph smoothly between different views of the same dataset. Its AI-assisted features help users find the most insightful chart types and transitions automatically. Ideal for data j
Vizzu
Free
Free Plan
API
Open Source
Vizzu is an open-source library for animated data visualizations and data stories, using a unique approach where charts morph smoothly between different views of the same dataset. Its AI-assisted features help users find the most insightful chart types and transitions automatically. Ideal for data j
 8
4.0
8
4.0
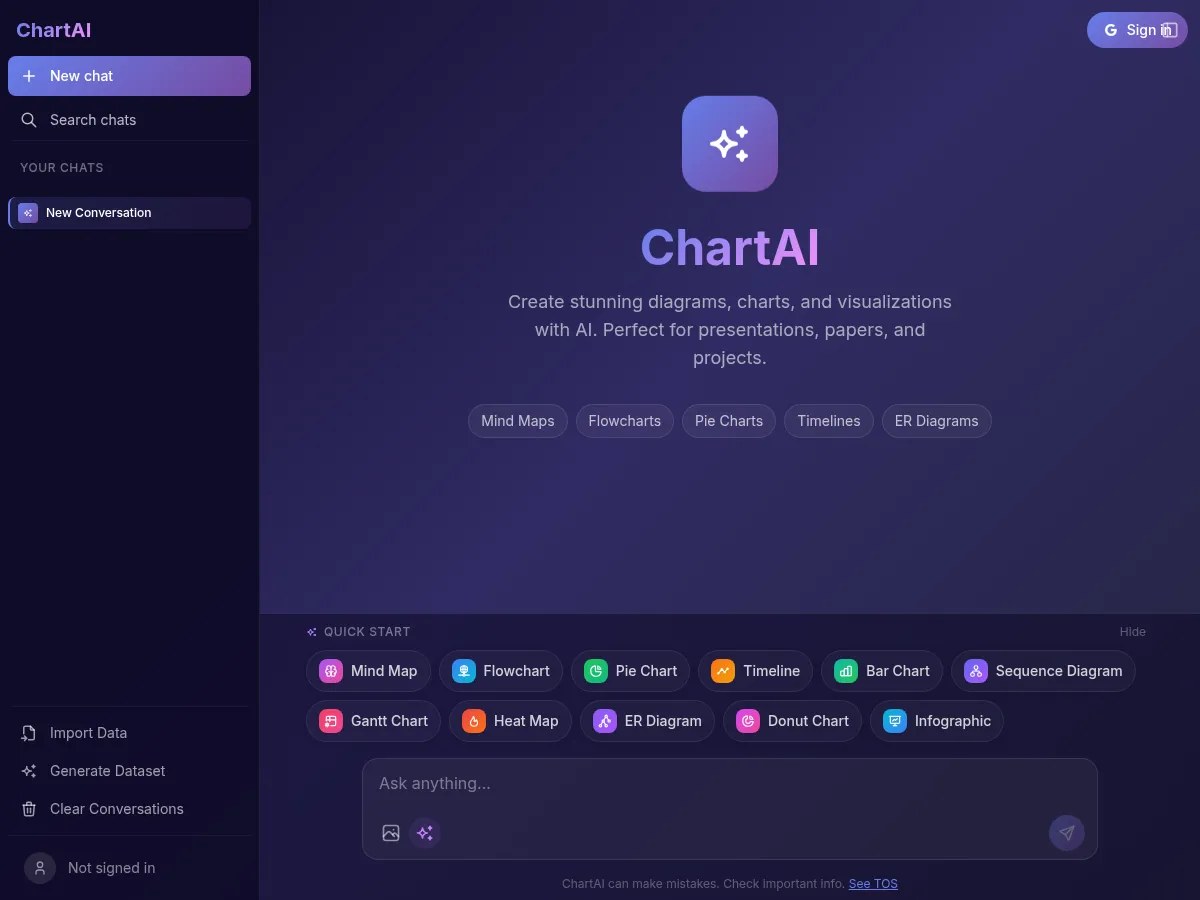
 ChartAI
Freemium
Free Plan
ChartAI generates professional data visualizations from natural language descriptions or raw data for presentations and reports.
ChartAI
Freemium
Free Plan
ChartAI generates professional data visualizations from natural language descriptions or raw data for presentations and reports.
 9
3.8
9
3.8
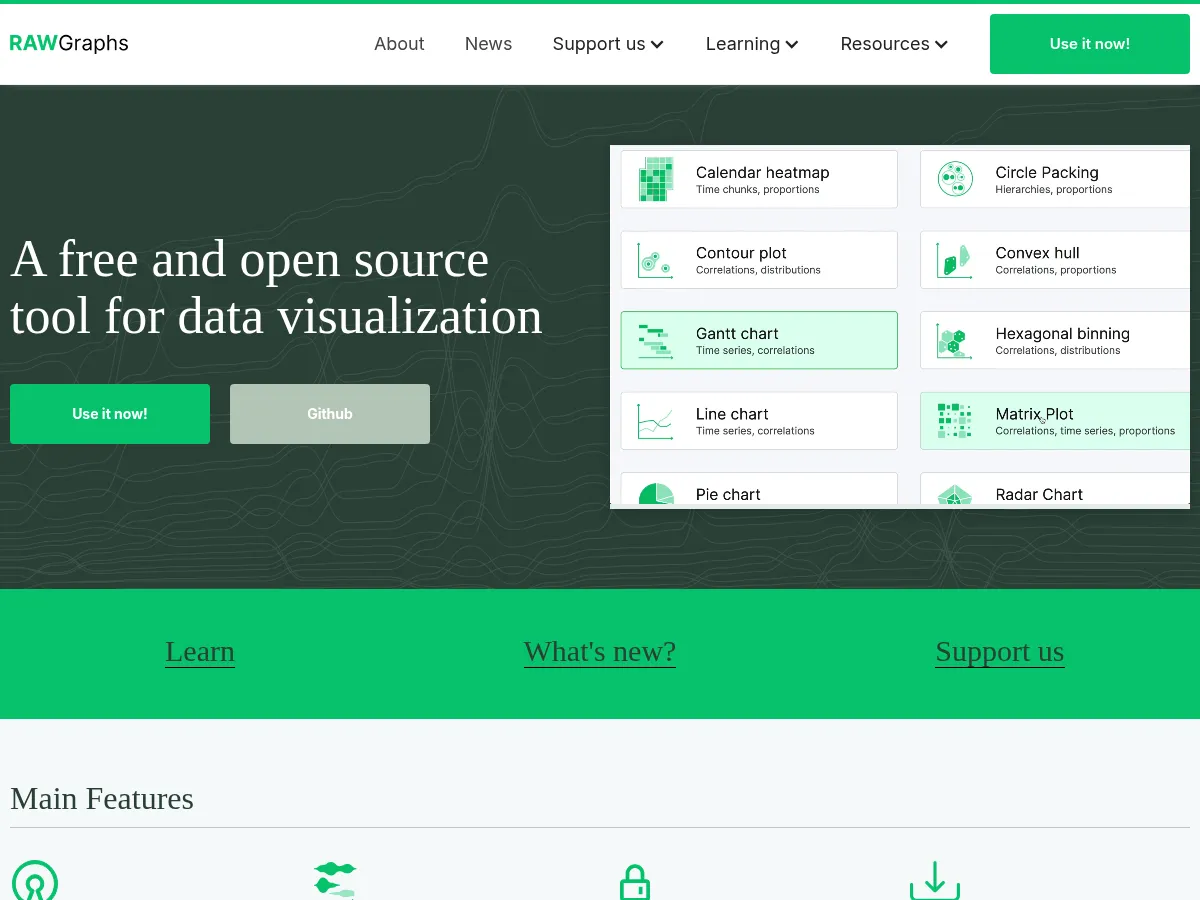
 RAWGraphs
Free
Free Plan
Open Source
RAWGraphs is an open-source data visualization framework designed to make complex data easy to visualize. It bridges the gap between spreadsheets and vector graphics, allowing users to create unconventional and advanced visualizations without coding. The tool processes data entirely in the browser f
RAWGraphs
Free
Free Plan
Open Source
RAWGraphs is an open-source data visualization framework designed to make complex data easy to visualize. It bridges the gap between spreadsheets and vector graphics, allowing users to create unconventional and advanced visualizations without coding. The tool processes data entirely in the browser f