RAWGraphs
Chi siamo
Dettagli dello strumento Gratuito
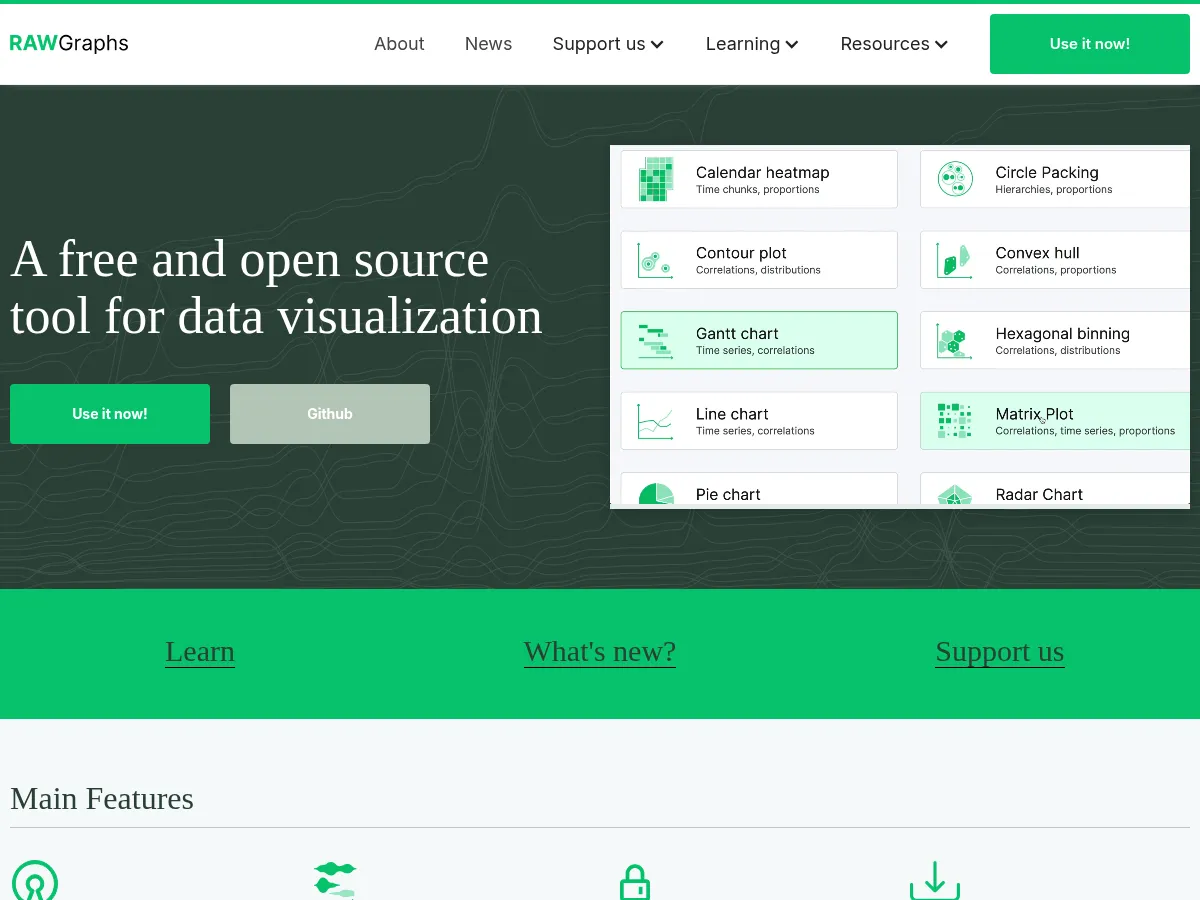
RAWGraphs is an open-source data visualization framework that excels at bridging the gap between spreadsheet data and custom vector-based visualizations. It allows users to paste or upload tabular data and quickly generate complex chart types " including alluvial diagrams, beeswarm plots, treemaps, and more " that go well beyond what typical charting tools offer. The drag-and-drop mapping interface is intuitive, and the ability to export as SVG makes it ideal for designers who want to refine visuals in tools like Illustrator or Figma. Being completely free and open-source is a major advantage. However, it's worth noting that RAWGraphs is more of a traditional visualization tool than a true AI-powered one " it doesn't leverage machine learning for automated insights, pattern detection, or smart chart recommendations. Limitations include no built-in collaboration features, no dashboard creation, and limited interactivity in outputs. For users seeking quick, beautiful, unconventional chart types without any cost, RAWGraphs is hard to beat, but those needing AI-driven analytics should look elsewhere.