การแสดงข้อมูลด้วย AI - ไดเรกทอรีพร้อมรีวิว AI
การเปลี่ยนข้อมูลดิบเป็นภาพที่ชัดเจนและน่าสนใจนั้นรวดเร็วขึ้นกว่าเดิมด้วยเครื่องมือสร้างแผนภูมิและแดชบอร์ดที่ได้รับความช่วยเหลือจาก AI Flourish และ Datawrapper ทำให้แผนภูมิมีคุณภาพพิมพ์สำหรับนักข่าวและนักวิเคราะห์โดยไม่ต้องเขียนโค้ด Infogram จัดการภาพประกอบข้อมูลและรายงาน ในขณะที่ Observable มอบสภาพแวดล้อมสมุดบันทึกแบบร่วมมือสำหรับนักวิทยาศาสตร์ข้อมูลเพื่อสร้างการแสดงข้อมูลแบบโต้ตอบด้วยโค้ด
 1
4.6
1
4.6
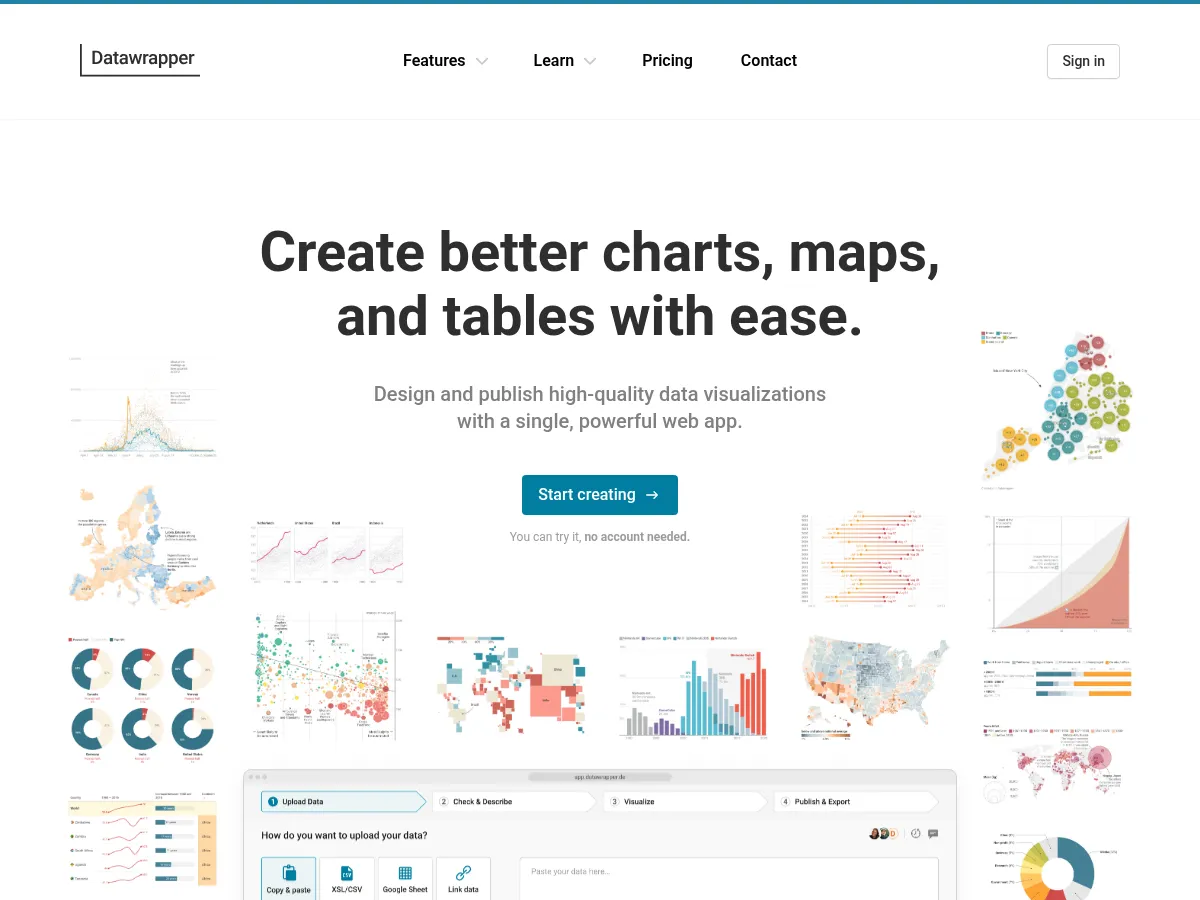
 Datawrapper
ฟรีเมียม
แผนฟรี
API
Datawrapper ได้รับความไว้วางใจจากห้องข่าวทั่วโลกสำหรับการเปลี่ยนข้อมูลดิบเป็นแผนภูมิ แผนที่ และตารางที่พร้อมเ�
Datawrapper
ฟรีเมียม
แผนฟรี
API
Datawrapper ได้รับความไว้วางใจจากห้องข่าวทั่วโลกสำหรับการเปลี่ยนข้อมูลดิบเป็นแผนภูมิ แผนที่ และตารางที่พร้อมเ�
 2
4.6
2
4.6
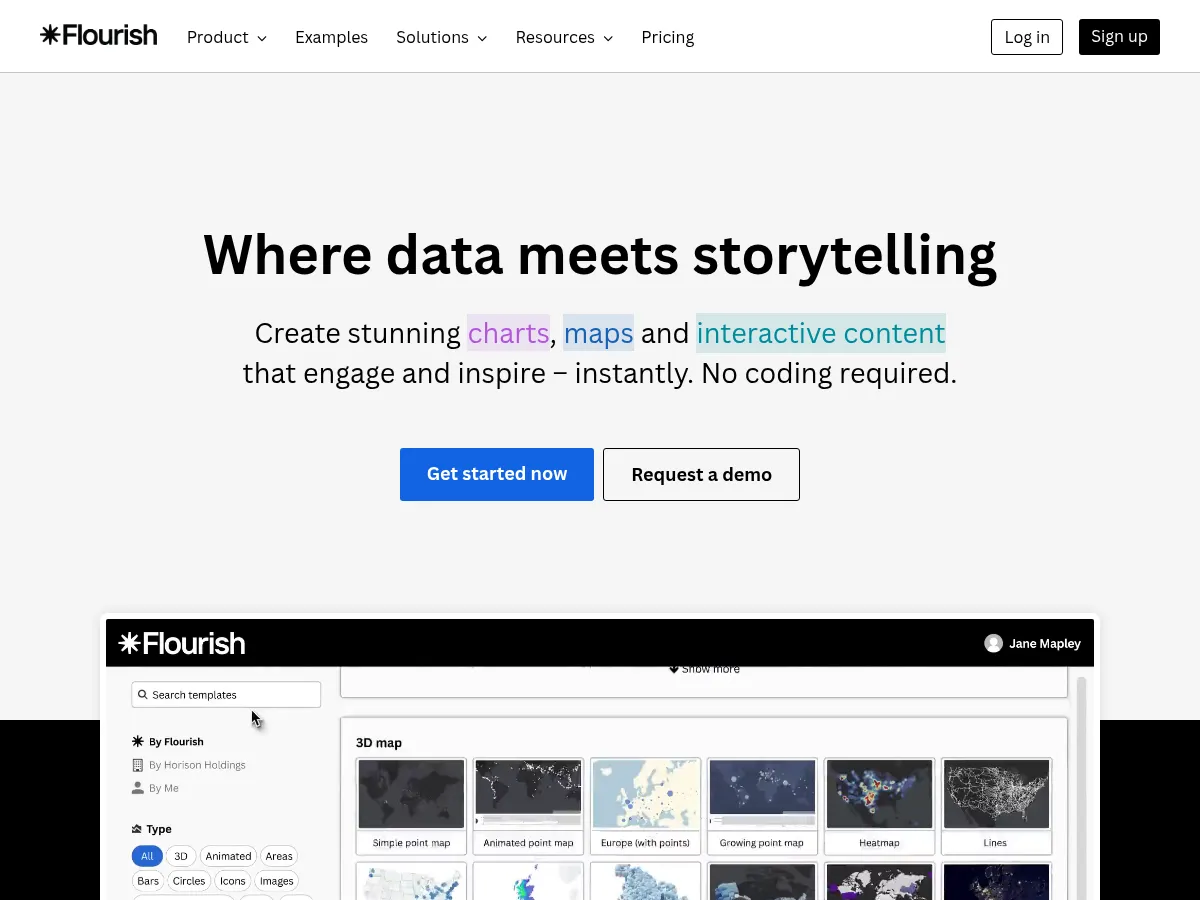
 Flourish
ฟรีเมียม
แผนฟรี
API
Flourish สร้างการแสดงภาพข้อมูลแบบโต้ตอบและมีภาพเคลื่อนไหวโดยไม่ต้องเขียนโค้ด ด้วยเทมเพลตที่ใช้โดยสำนักพิมพ�
Flourish
ฟรีเมียม
แผนฟรี
API
Flourish สร้างการแสดงภาพข้อมูลแบบโต้ตอบและมีภาพเคลื่อนไหวโดยไม่ต้องเขียนโค้ด ด้วยเทมเพลตที่ใช้โดยสำนักพิมพ�
 3
4.5
3
4.5
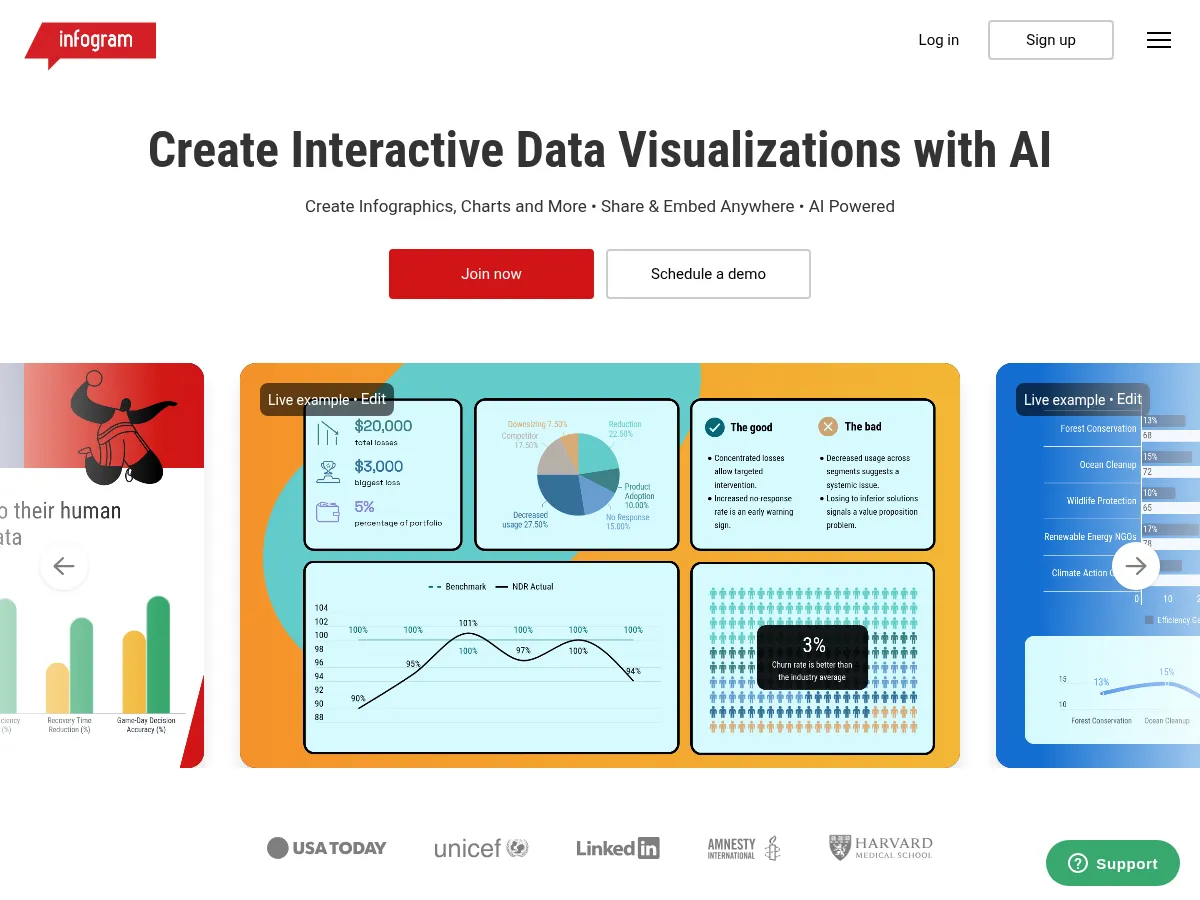
 Infogram
ฟรีเมียม
แผนฟรี
API
Infogram is an intuitive data visualization and infographic platform that uses AI to help users create interactive charts, maps, dashboards, and reports. It automatically suggests the best chart types for your data and provides smart formatting to ensure visual clarity. With over 35 chart types, 500
Infogram
ฟรีเมียม
แผนฟรี
API
Infogram is an intuitive data visualization and infographic platform that uses AI to help users create interactive charts, maps, dashboards, and reports. It automatically suggests the best chart types for your data and provides smart formatting to ensure visual clarity. With over 35 chart types, 500
 4
4.4
4
4.4
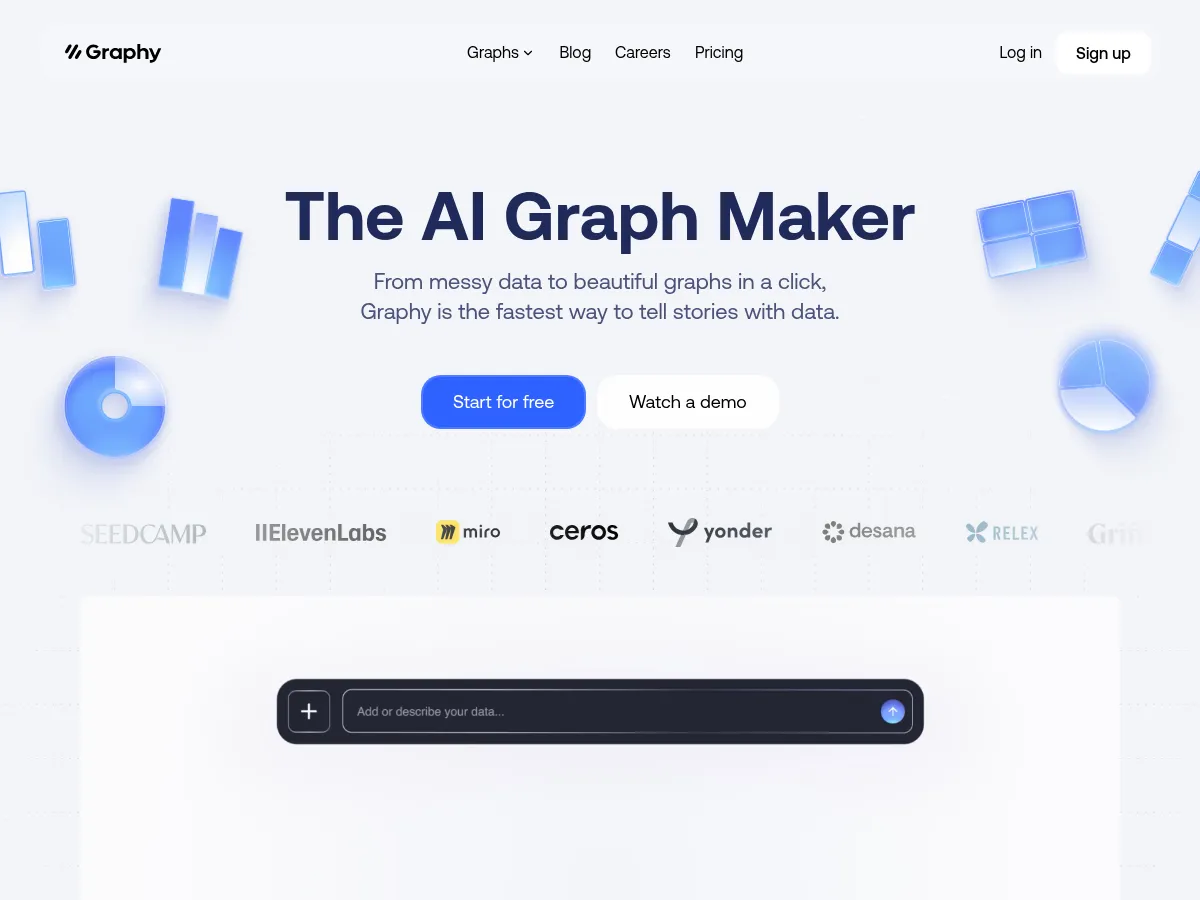
 Graphy
ฟรีเมียม
แผนฟรี
Graphy ใช้ AI เพื่อสร้างแผนภูมิแบบโต้ตอบที่ฝังตัวได้จากข้อมูลสเปรดชีตโดยมีการจัดรูปแบบอัตโนมัติ
Graphy
ฟรีเมียม
แผนฟรี
Graphy ใช้ AI เพื่อสร้างแผนภูมิแบบโต้ตอบที่ฝังตัวได้จากข้อมูลสเปรดชีตโดยมีการจัดรูปแบบอัตโนมัติ
 5
4.4
5
4.4
 Observable
ฟรีเมียม
แผนฟรี
API
Observable is a collaborative data visualization and analysis platform built around reactive JavaScript notebooks. It enables teams to explore datasets and build interactive visualizations using D3.js, Plot, and other libraries in a live-coding environment. Observable's Framework supports AI-assiste
Observable
ฟรีเมียม
แผนฟรี
API
Observable is a collaborative data visualization and analysis platform built around reactive JavaScript notebooks. It enables teams to explore datasets and build interactive visualizations using D3.js, Plot, and other libraries in a live-coding environment. Observable's Framework supports AI-assiste
 6
4.3
6
4.3
 Polymer Search
ฟรีเมียม
แผนฟรี
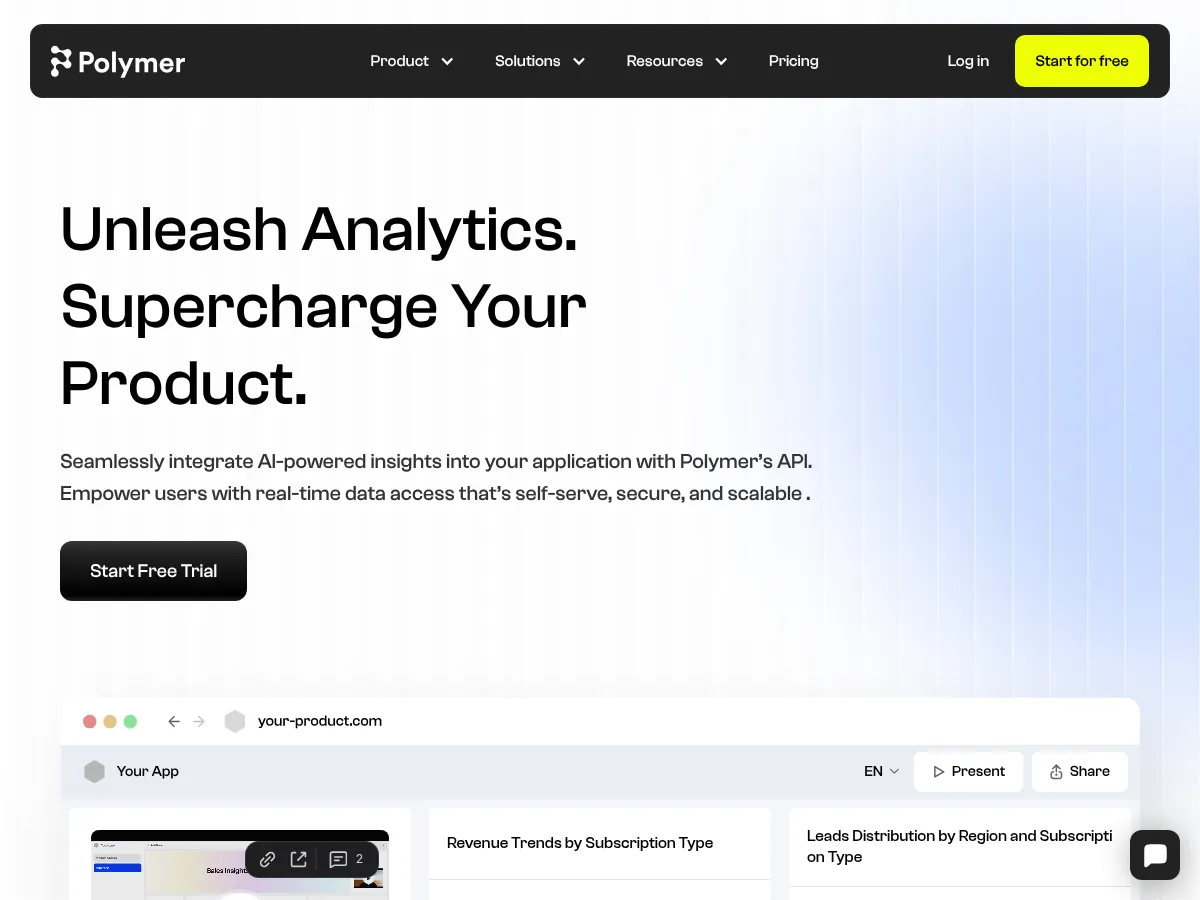
Polymer Search transforms spreadsheets and datasets into interactive, searchable databases with AI-generated visualizations and dashboards. Users can upload data from Google Sheets, Excel, CSV, or connect to platforms like Shopify and Google Analytics, and the AI engine automatically creates meaning
Polymer Search
ฟรีเมียม
แผนฟรี
Polymer Search transforms spreadsheets and datasets into interactive, searchable databases with AI-generated visualizations and dashboards. Users can upload data from Google Sheets, Excel, CSV, or connect to platforms like Shopify and Google Analytics, and the AI engine automatically creates meaning
 7
4.3
7
4.3
 Vizzu
ฟรี
แผนฟรี
API
โอเพ่นซอร์ส
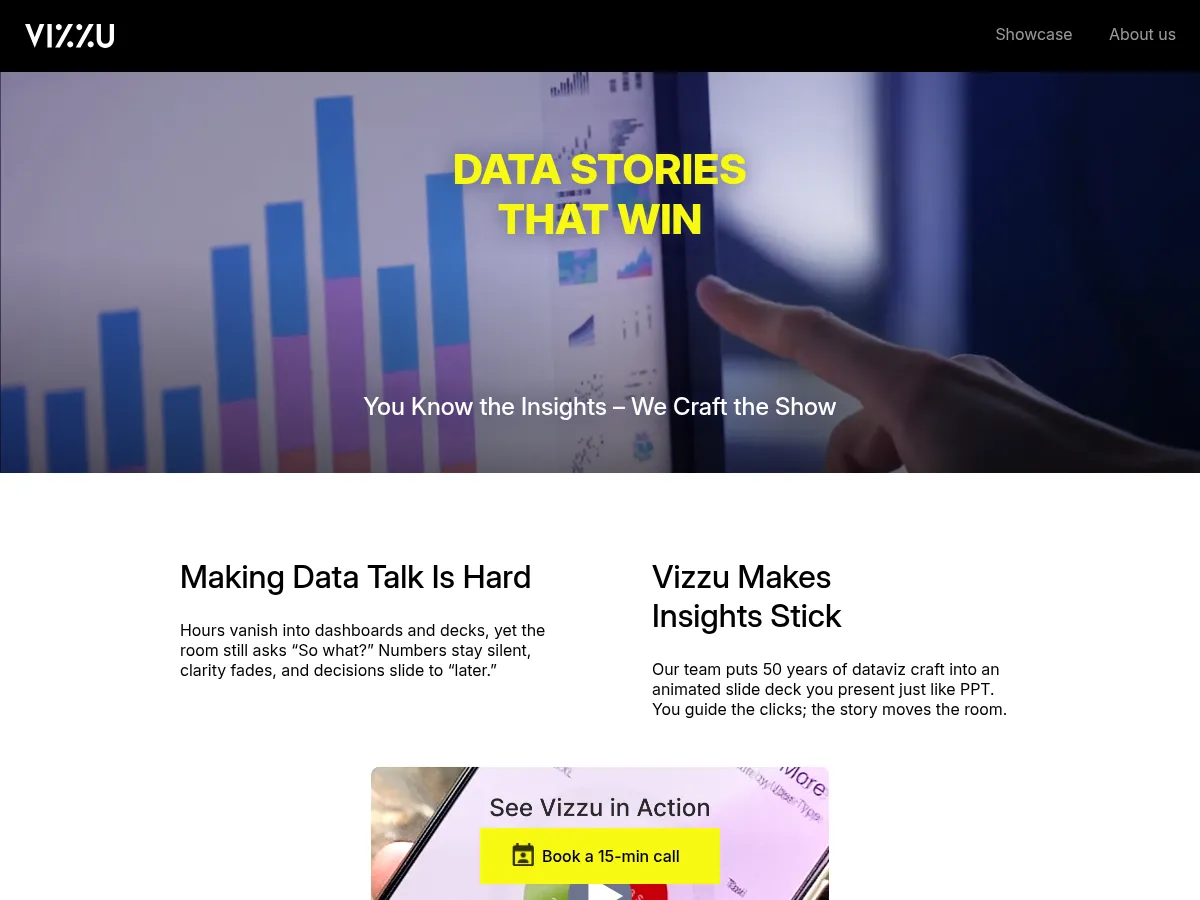
Vizzu is an open-source library for animated data visualizations and data stories, using a unique approach where charts morph smoothly between different views of the same dataset. Its AI-assisted features help users find the most insightful chart types and transitions automatically. Ideal for data j
Vizzu
ฟรี
แผนฟรี
API
โอเพ่นซอร์ส
Vizzu is an open-source library for animated data visualizations and data stories, using a unique approach where charts morph smoothly between different views of the same dataset. Its AI-assisted features help users find the most insightful chart types and transitions automatically. Ideal for data j
 8
4.0
8
4.0
 ChartAI
ฟรีเมียม
แผนฟรี
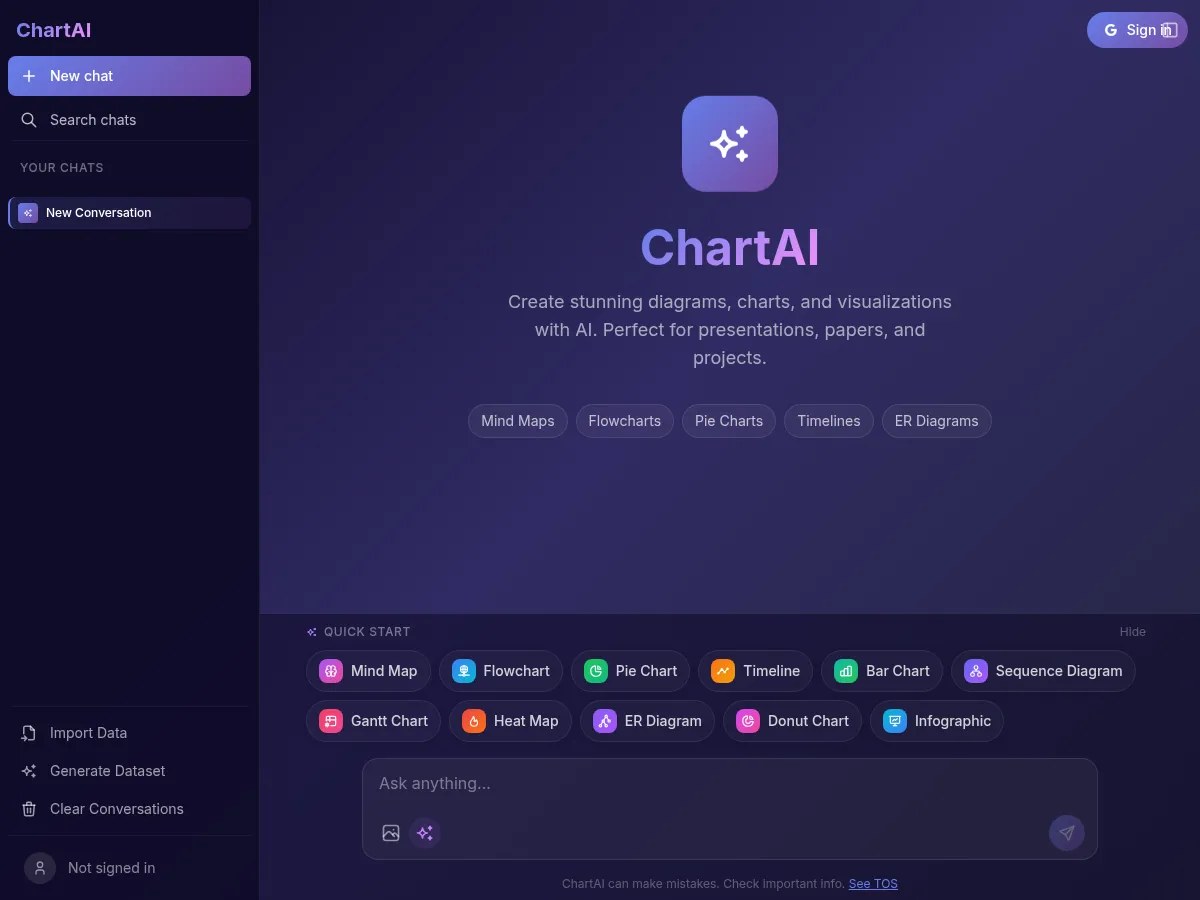
ChartAI สร้างการแสดงข้อมูลแบบมืออาชีพจากคำอธิบายภาษาธรรมชาติหรือข้อมูลดิบสำหรับการนำเสนอและรายงาน
ChartAI
ฟรีเมียม
แผนฟรี
ChartAI สร้างการแสดงข้อมูลแบบมืออาชีพจากคำอธิบายภาษาธรรมชาติหรือข้อมูลดิบสำหรับการนำเสนอและรายงาน
 9
3.8
9
3.8
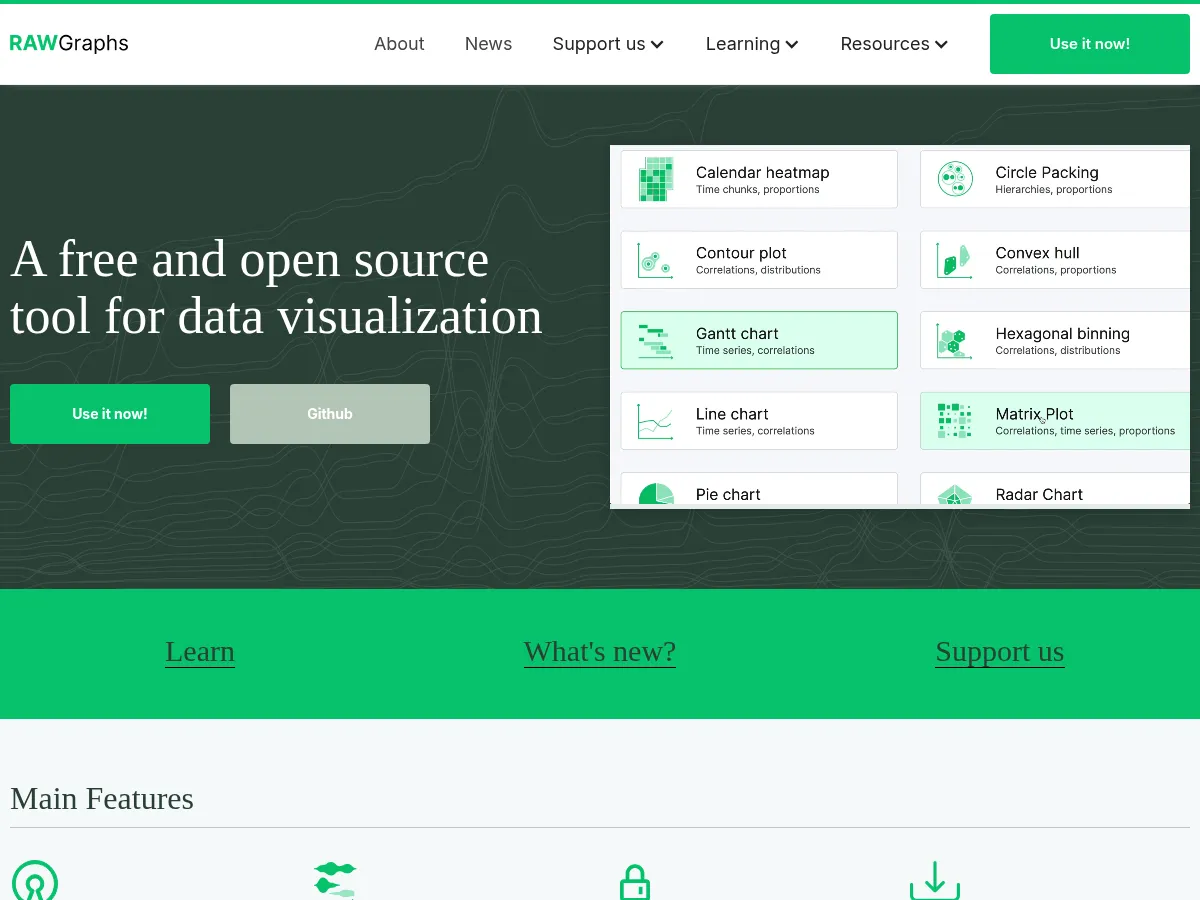
 RAWGraphs
ฟรี
แผนฟรี
โอเพ่นซอร์ส
RAWGraphs is an open-source data visualization framework designed to make complex data easy to visualize. It bridges the gap between spreadsheets and vector graphics, allowing users to create unconventional and advanced visualizations without coding. The tool processes data entirely in the browser f
RAWGraphs
ฟรี
แผนฟรี
โอเพ่นซอร์ส
RAWGraphs is an open-source data visualization framework designed to make complex data easy to visualize. It bridges the gap between spreadsheets and vector graphics, allowing users to create unconventional and advanced visualizations without coding. The tool processes data entirely in the browser f