AI 数据可视化 - 含AI评论的目录
借助 AI 辅助的图表和仪表板工具,将原始数据转化为清晰、引人注目的视觉效果比以往任何时候都更快。Flourish 和 Datawrapper 让记者和分析师无需编码即可制作出版级质量的图表。Infogram 处理信息图表和报告,而 Observable 则为数据科学家提供了一个协作式笔记本环境,用于通过代码构建交互式可视化。
 1
4.6
1
4.6
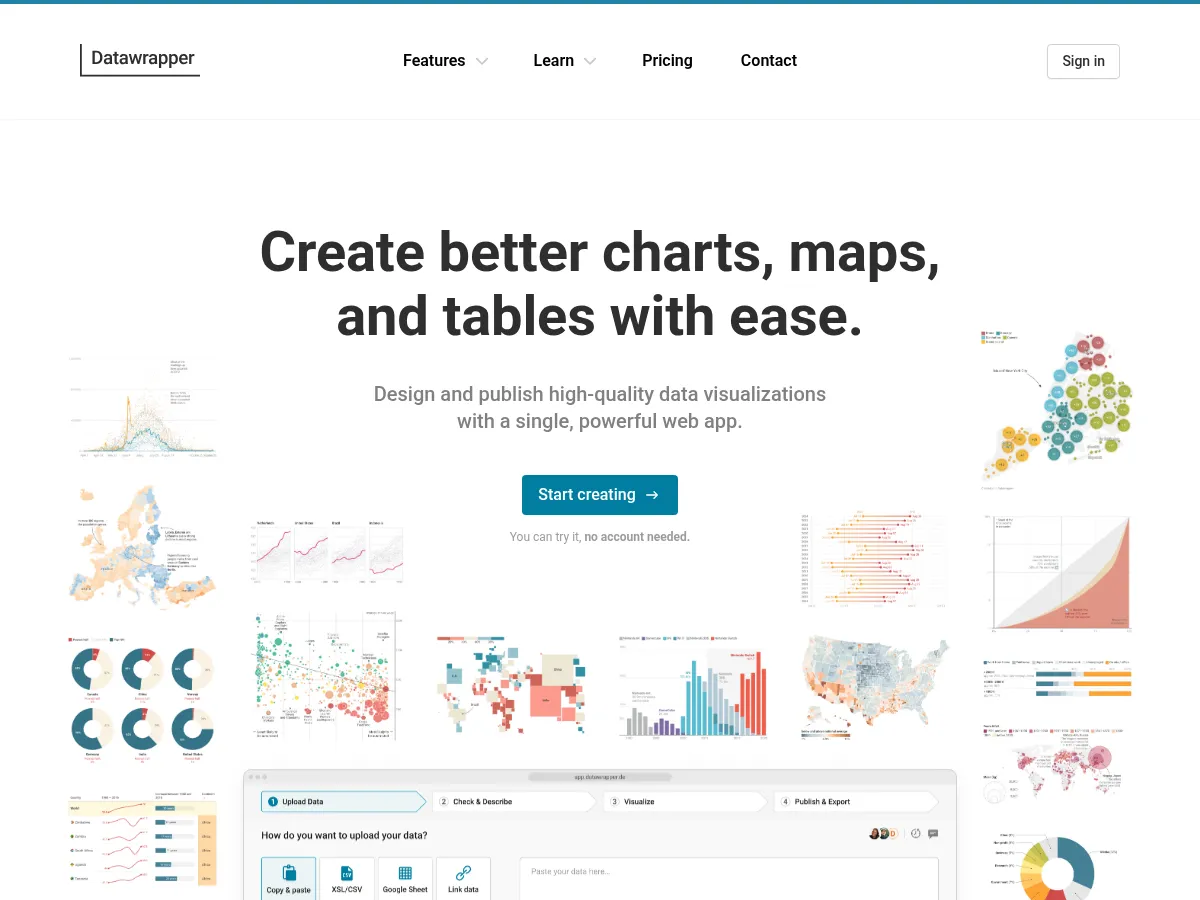
 Datawrapper
免费增值
免费计划
API
Datawrapper 受到全球新闻编辑室的信任,可将原始数据转换为出版就绪的图表、地图和表格。
Datawrapper
免费增值
免费计划
API
Datawrapper 受到全球新闻编辑室的信任,可将原始数据转换为出版就绪的图表、地图和表格。
 2
4.6
2
4.6
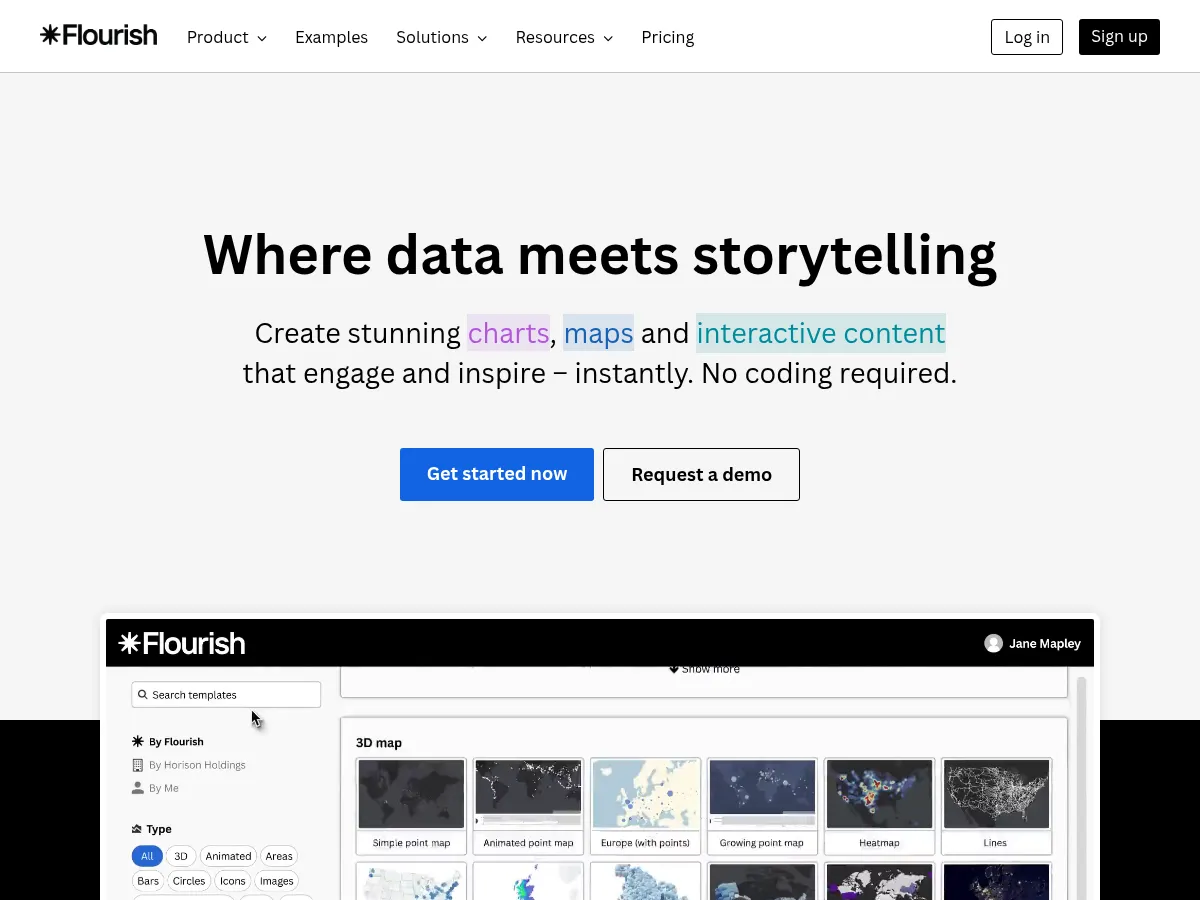
 Flourish
免费增值
免费计划
API
Flourish 创建交互式的动画数据可视化,无需编码,其模板被主要出版商使用。
Flourish
免费增值
免费计划
API
Flourish 创建交互式的动画数据可视化,无需编码,其模板被主要出版商使用。
 3
4.5
3
4.5
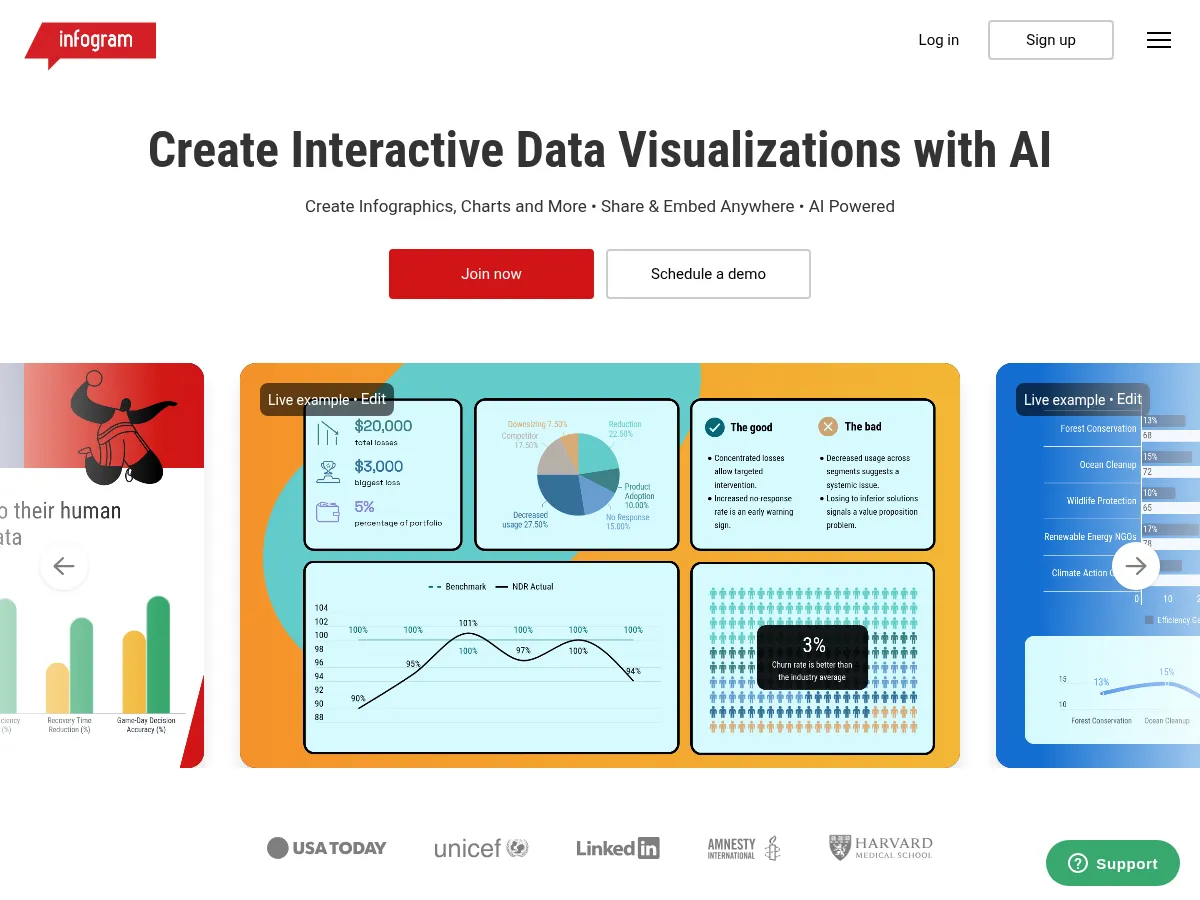
 Infogram
免费增值
免费计划
API
Infogram is an intuitive data visualization and infographic platform that uses AI to help users create interactive charts, maps, dashboards, and reports. It automatically suggests the best chart types for your data and provides smart formatting to ensure visual clarity. With over 35 chart types, 500
Infogram
免费增值
免费计划
API
Infogram is an intuitive data visualization and infographic platform that uses AI to help users create interactive charts, maps, dashboards, and reports. It automatically suggests the best chart types for your data and provides smart formatting to ensure visual clarity. With over 35 chart types, 500
 4
4.4
4
4.4
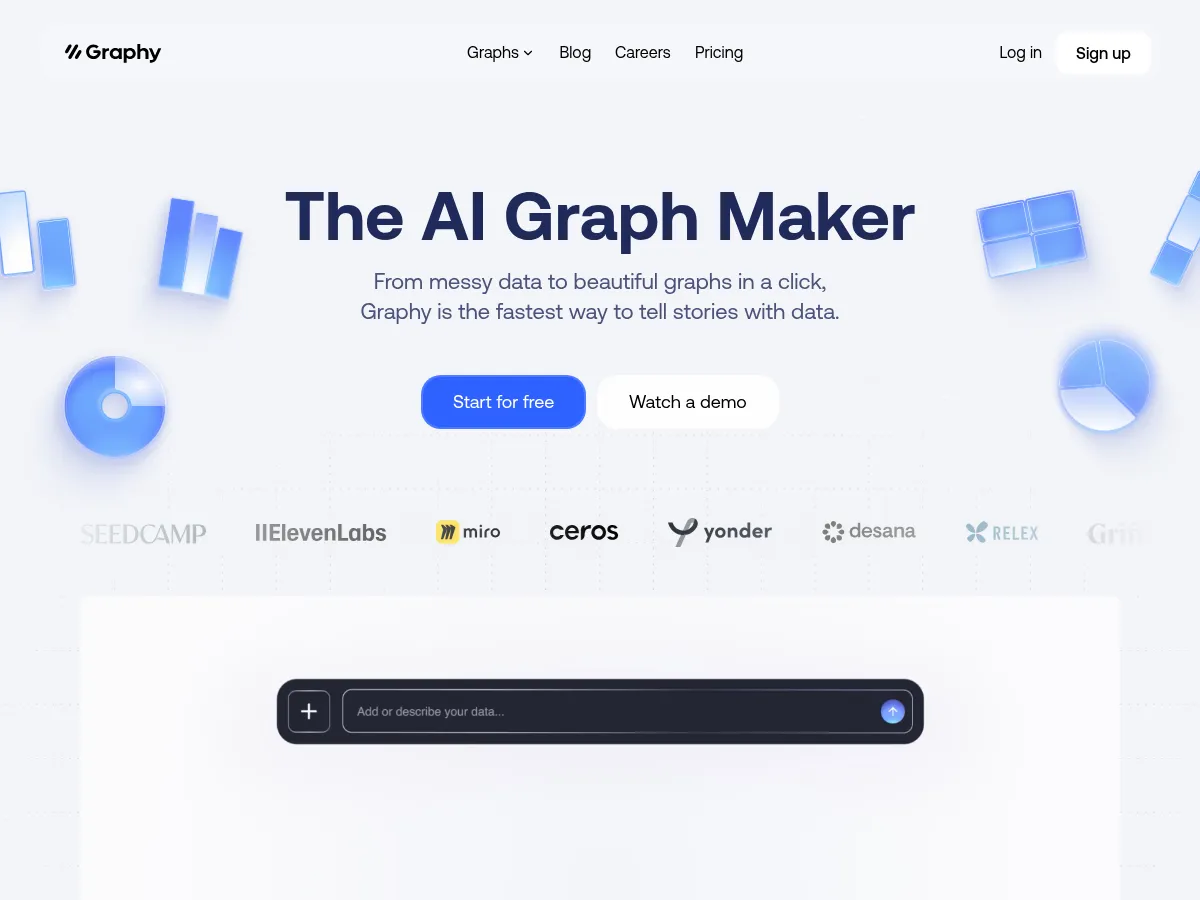
 Graphy
免费增值
免费计划
Graphy 使用人工智能从电子表格数据创建交互式、可嵌入的图表,具有自动格式化功能。
Graphy
免费增值
免费计划
Graphy 使用人工智能从电子表格数据创建交互式、可嵌入的图表,具有自动格式化功能。
 5
4.4
5
4.4
 Observable
免费增值
免费计划
API
Observable is a collaborative data visualization and analysis platform built around reactive JavaScript notebooks. It enables teams to explore datasets and build interactive visualizations using D3.js, Plot, and other libraries in a live-coding environment. Observable's Framework supports AI-assiste
Observable
免费增值
免费计划
API
Observable is a collaborative data visualization and analysis platform built around reactive JavaScript notebooks. It enables teams to explore datasets and build interactive visualizations using D3.js, Plot, and other libraries in a live-coding environment. Observable's Framework supports AI-assiste
 6
4.3
6
4.3
 Polymer Search
免费增值
免费计划
Polymer Search transforms spreadsheets and datasets into interactive, searchable databases with AI-generated visualizations and dashboards. Users can upload data from Google Sheets, Excel, CSV, or connect to platforms like Shopify and Google Analytics, and the AI engine automatically creates meaning
Polymer Search
免费增值
免费计划
Polymer Search transforms spreadsheets and datasets into interactive, searchable databases with AI-generated visualizations and dashboards. Users can upload data from Google Sheets, Excel, CSV, or connect to platforms like Shopify and Google Analytics, and the AI engine automatically creates meaning
 7
4.3
7
4.3
 Vizzu
免费
免费计划
API
开源
Vizzu is an open-source library for animated data visualizations and data stories, using a unique approach where charts morph smoothly between different views of the same dataset. Its AI-assisted features help users find the most insightful chart types and transitions automatically. Ideal for data j
Vizzu
免费
免费计划
API
开源
Vizzu is an open-source library for animated data visualizations and data stories, using a unique approach where charts morph smoothly between different views of the same dataset. Its AI-assisted features help users find the most insightful chart types and transitions automatically. Ideal for data j
 8
4.0
8
4.0
 ChartAI
免费增值
免费计划
ChartAI 根据自然语言描述或原始数据生成专业数据可视化,用于演示和报告。
ChartAI
免费增值
免费计划
ChartAI 根据自然语言描述或原始数据生成专业数据可视化,用于演示和报告。
 9
3.8
9
3.8
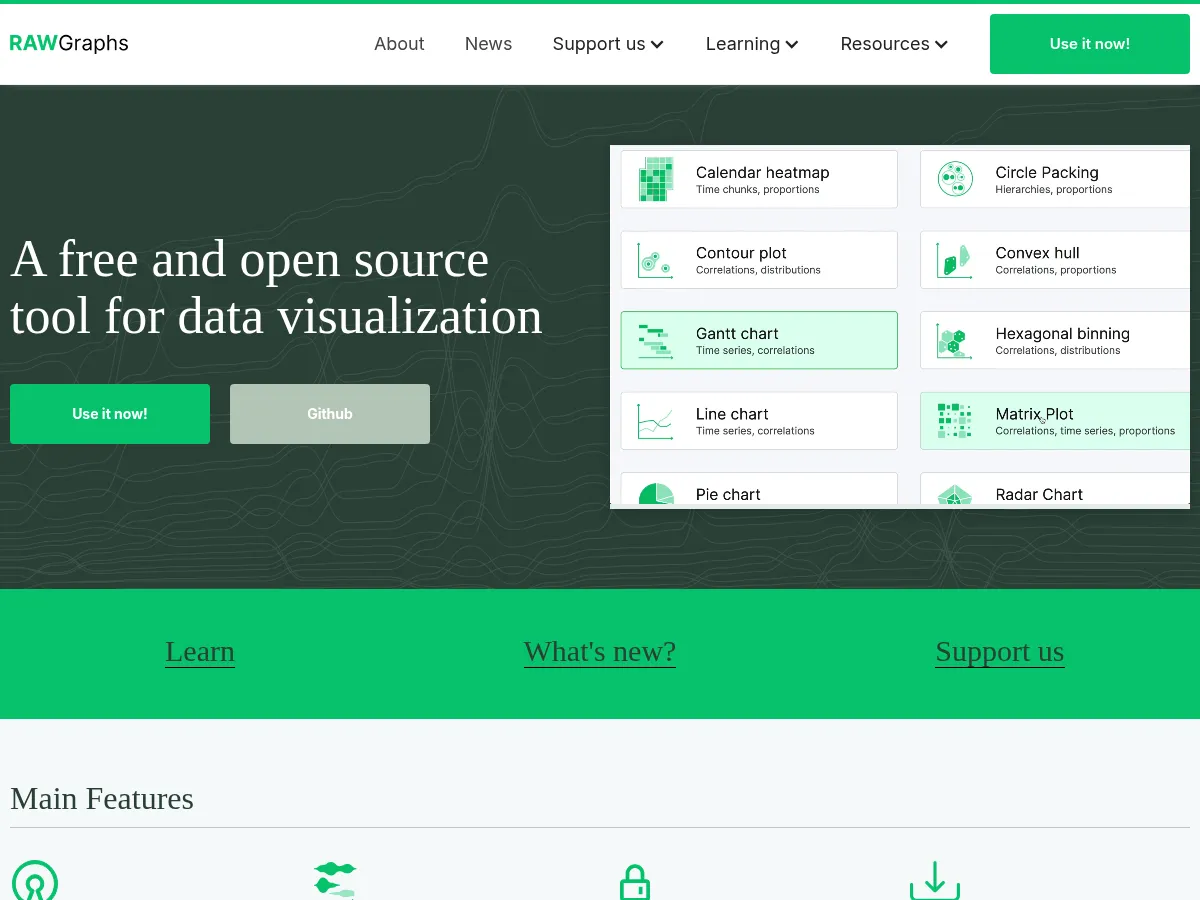
 RAWGraphs
免费
免费计划
开源
RAWGraphs is an open-source data visualization framework designed to make complex data easy to visualize. It bridges the gap between spreadsheets and vector graphics, allowing users to create unconventional and advanced visualizations without coding. The tool processes data entirely in the browser f
RAWGraphs
免费
免费计划
开源
RAWGraphs is an open-source data visualization framework designed to make complex data easy to visualize. It bridges the gap between spreadsheets and vector graphics, allowing users to create unconventional and advanced visualizations without coding. The tool processes data entirely in the browser f